You can use the Lists and Parameters modules to build complex cascading slicers containing multiple levels. The diagram below explains the general technique used to manually build cascading slicers:
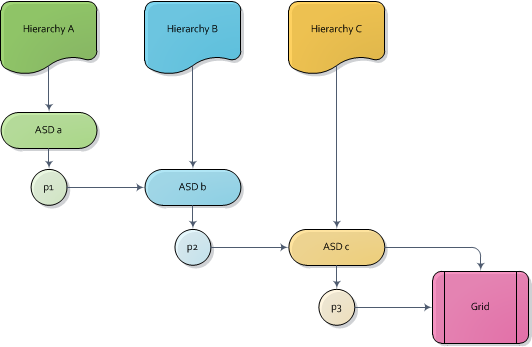
- Create a top level set using the custom set designer('ASD a') in the first hierarchy (A).
- In hierarchy A create a new parameter (p1) and use 'ASD a' as the source input for the listing of its elements.
- Now create a new set ('ASD 'b') using the second hierarchy (B). Ensure this set uses a NON EMPTY filter, which employs selections from the p1 parameter created in hierarchy A from step 2 above.
- In hierarchy B create a new parameter (p2) and use set b from step 3 as the source input for the listing of its elements.
- Now create a new set ('ASD c') using the third hierarchy (C). Ensure this set uses a NON EMPTY filter, which employs selections from the p2 parameter created in hierarchy B from step 4 above.
- Lastly, either put the final set ('ASD c') into the grid as its selections or create another parameter (p3) that feeds yet another hierarchy's set (and so on).
When the user deploys the final set as either a slice or a selection in the columns or rows, the previous selections that all feed into it will appear as slicers on the report canvas. As a user changes the highest level slice, all subsequent slicers will change accordingly and the result will be visible in the grid.
Walkthrough: Manually Build a Cascading Slicer
In the example, the cascading slicer will filter from Country, to State, to City.
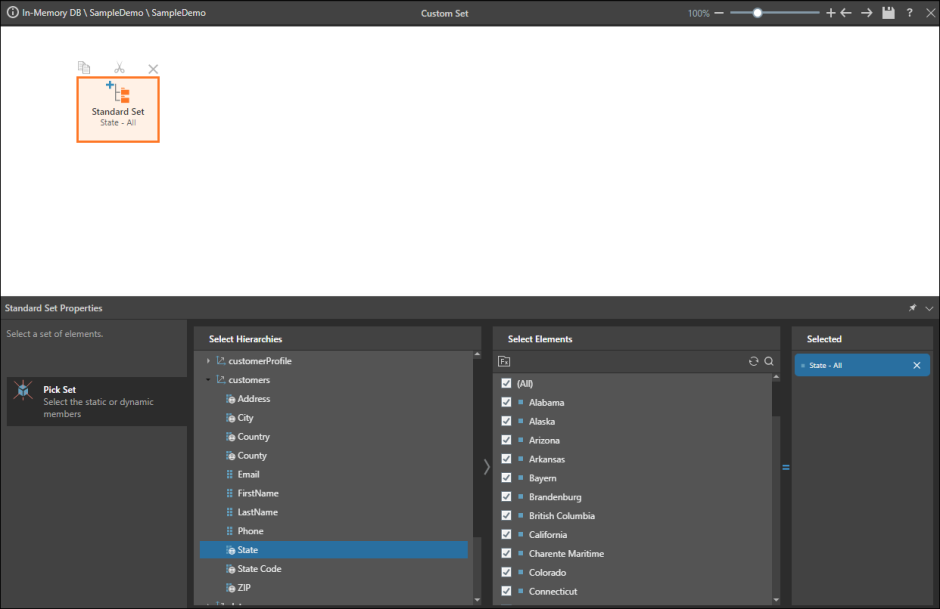
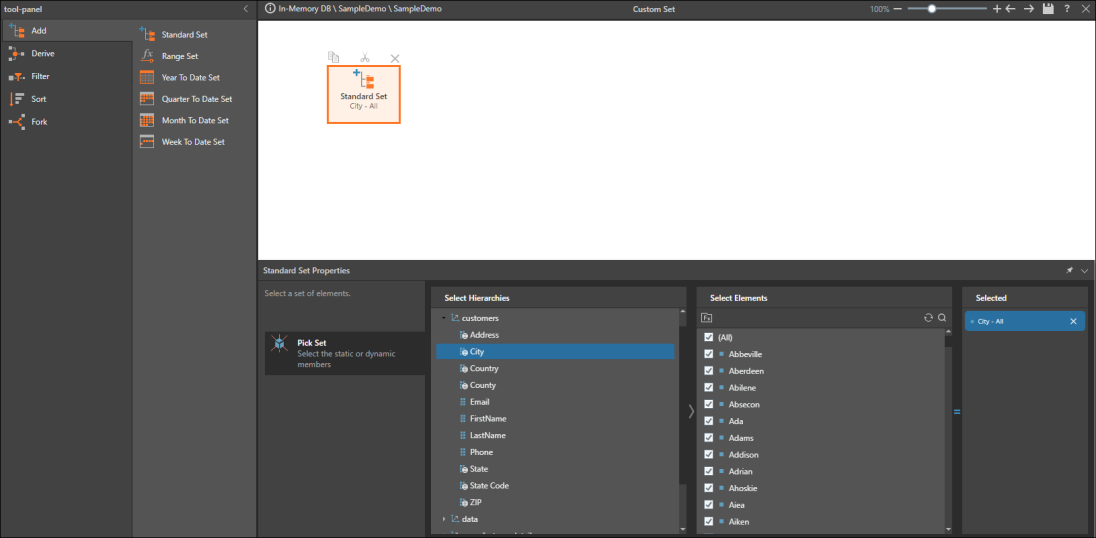
STEP 1
Start by building a custom set of all states in List. Add the Standard Set node, select the State hierarchy, and then select all states, and save the custom set.
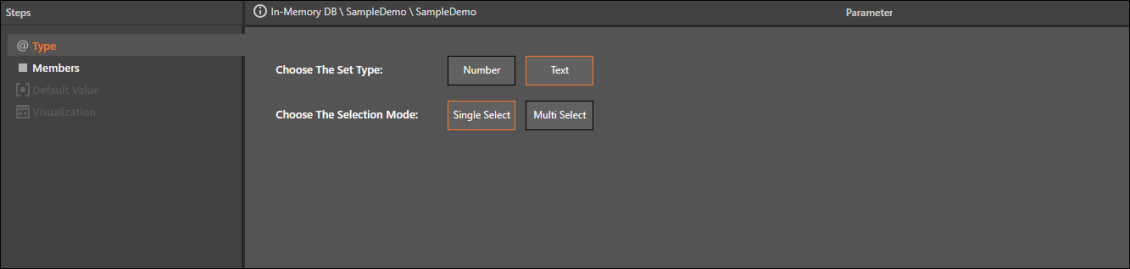
STEP 2
Build a Model Parameter. In Type, select Text and Single Select.
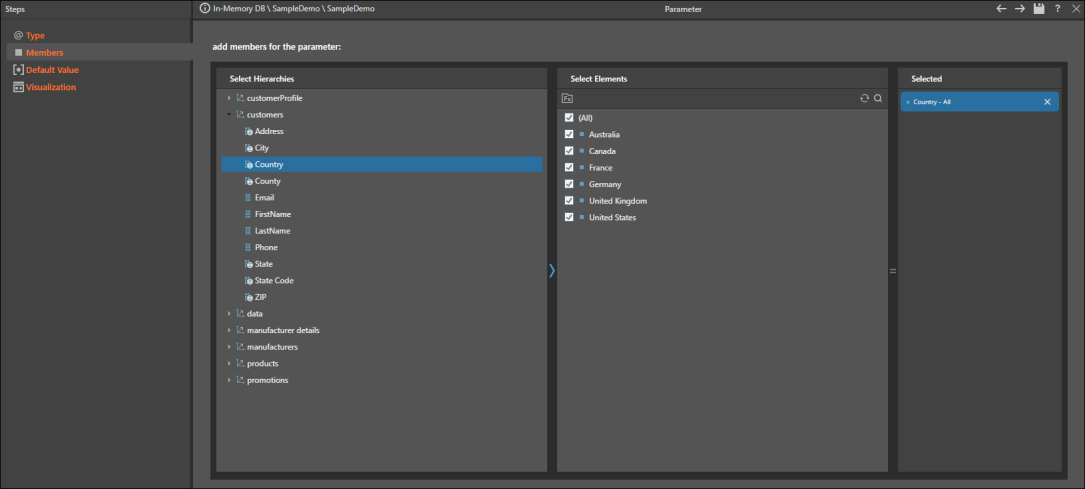
STEP 3
In Members, select the Country hierarchy, and then in the Elements panel select all countries. Select the Default Value and the Visualization type, and save the parameter.
STEP 4
Go back to the States custom set in List. Add a Non Empty node from the Filter tools.
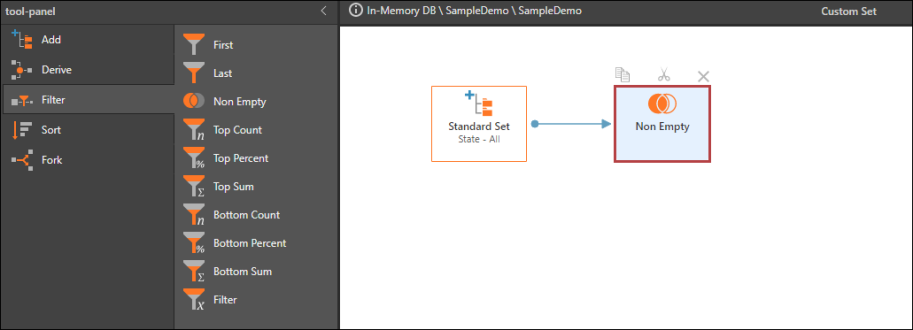
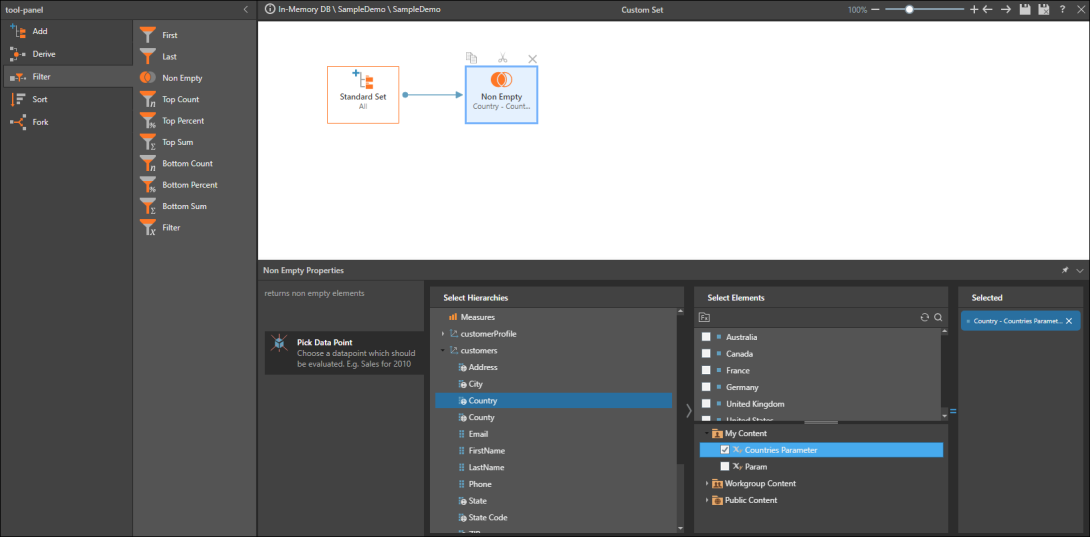
STEP 5
Select the Country hierarchy, and in the Elements panel click the Fx button. Find and select the countries parameter that was saved in Step 3. Save the custom set.
STEP 6
Build a second custom set in List - add the Standard Set node and select all cities from the City hierarchy. Save the new custom set.
STEP 7
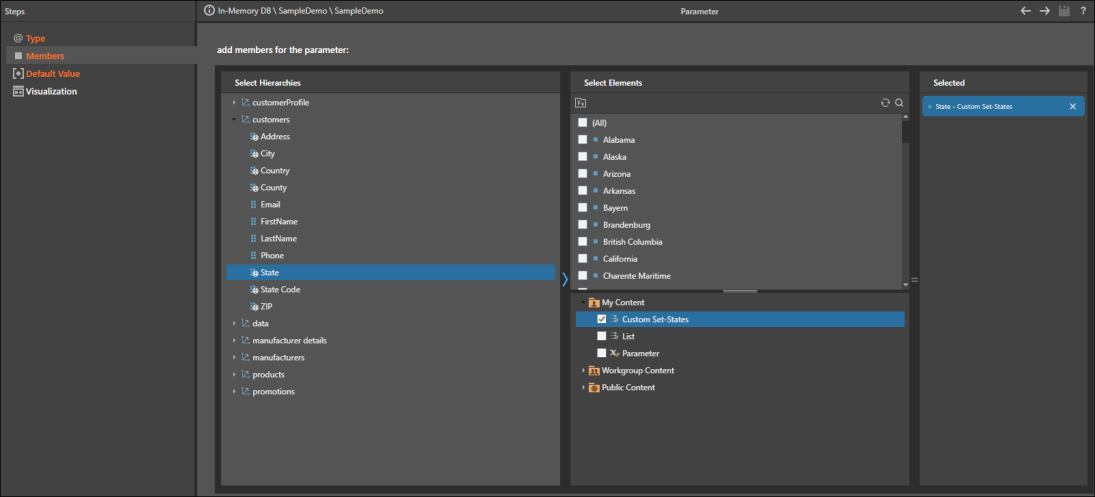
The states custom set must now be parameterized.
Build another parameter, selecting Text and Single Select under Type. Under Members, select the State hierarchy. In the Elements panel, click the Fx button, then find and select the states custom set that was saved in Step 5.
Note that the states custom set already contains a countries parameter. The new states parameter will therefore contain two parameters: countries and states.
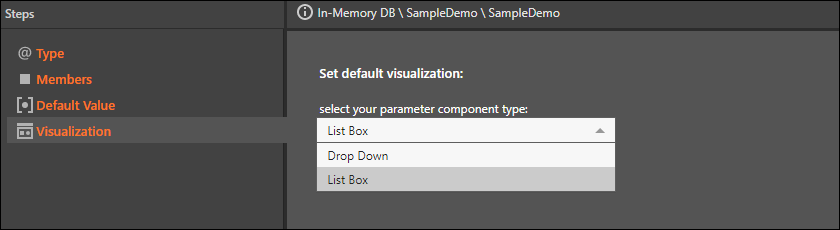
STEP 8
Select the Default Value, and under Visualization select List Box. Save the parameter.
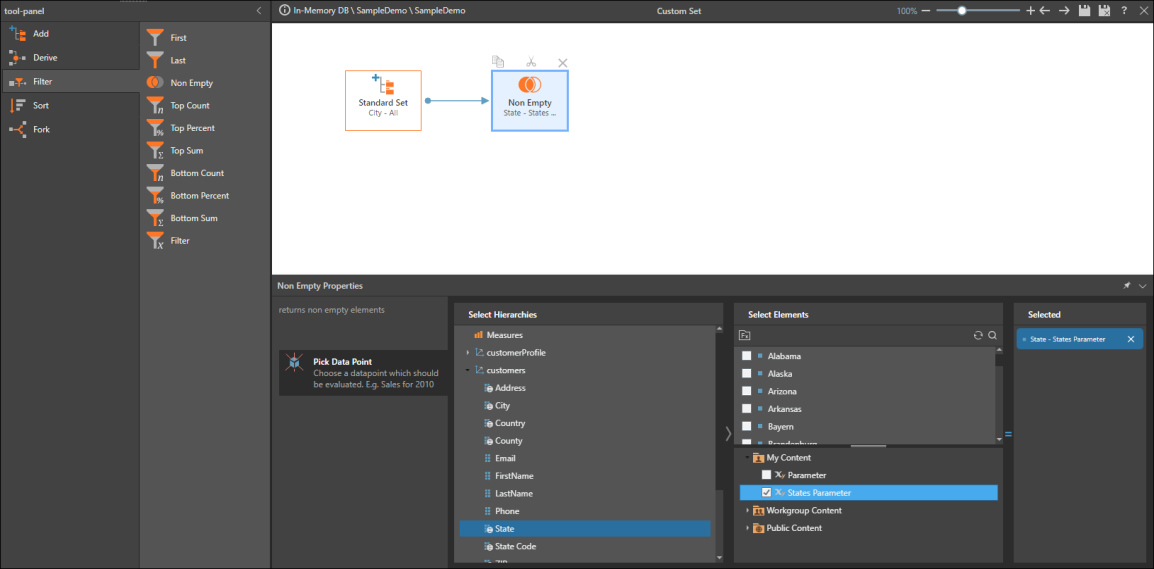
STEP 9
Go back to the cities custom set built in Step 6. Add the Non Empty node from the Filter tools, and select the State hierarchy. In the Elements panel click the Fx button, and find and select the states parameter. Save the custom set.
Note that the cities custom set now contains a list of cities which cascades from the states parameter. The states parameter contains a list of states which cascades from the countries parameter.
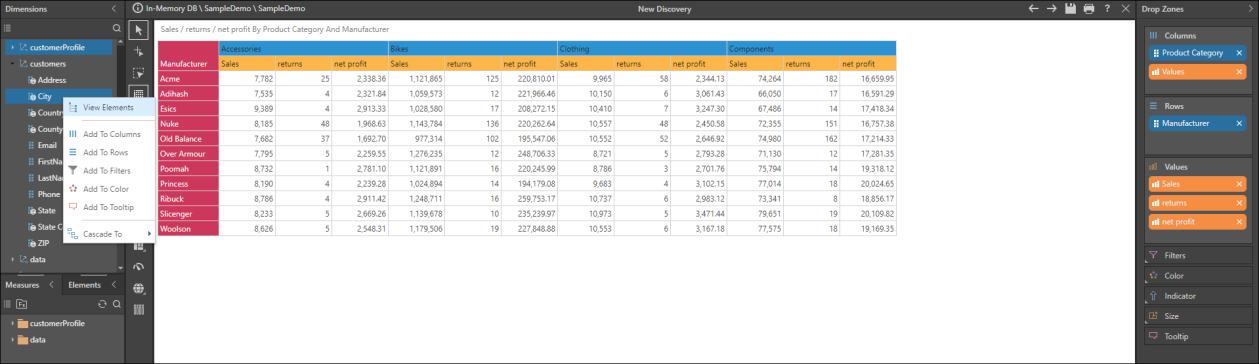
STEP 10
Open Discover and build your query. To add the cascading slicer, right click on the City hierarchy in the Dimensions panel, and select View Elements.
STEP 11
Click the Fx button in the Elements panel, and find and select the cities custom set.
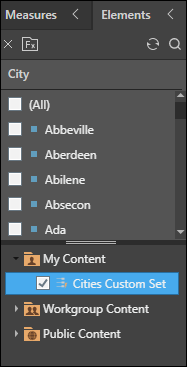
STEP 12
The custom set will be added to the Filters zone, and will act as a cascading slicer.
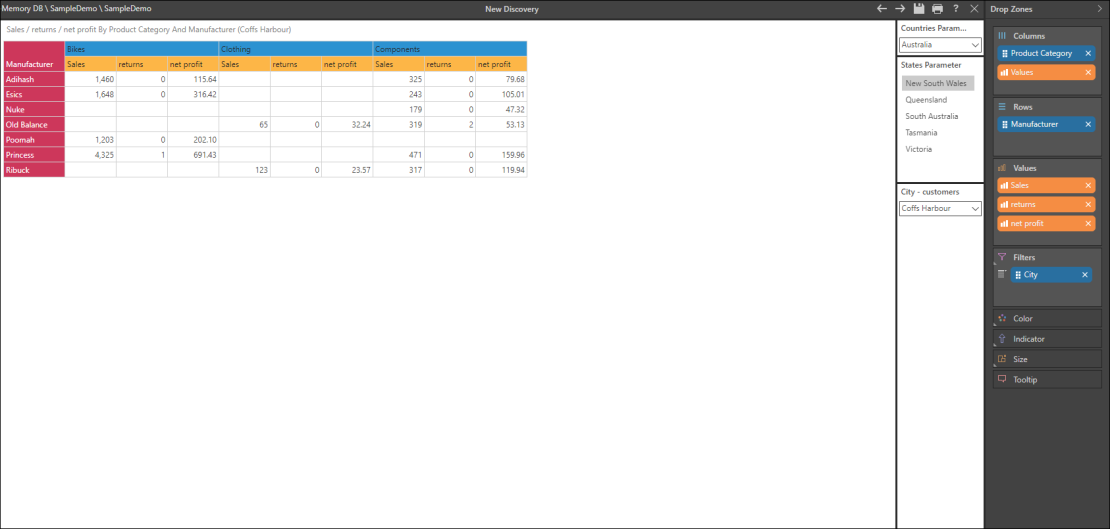
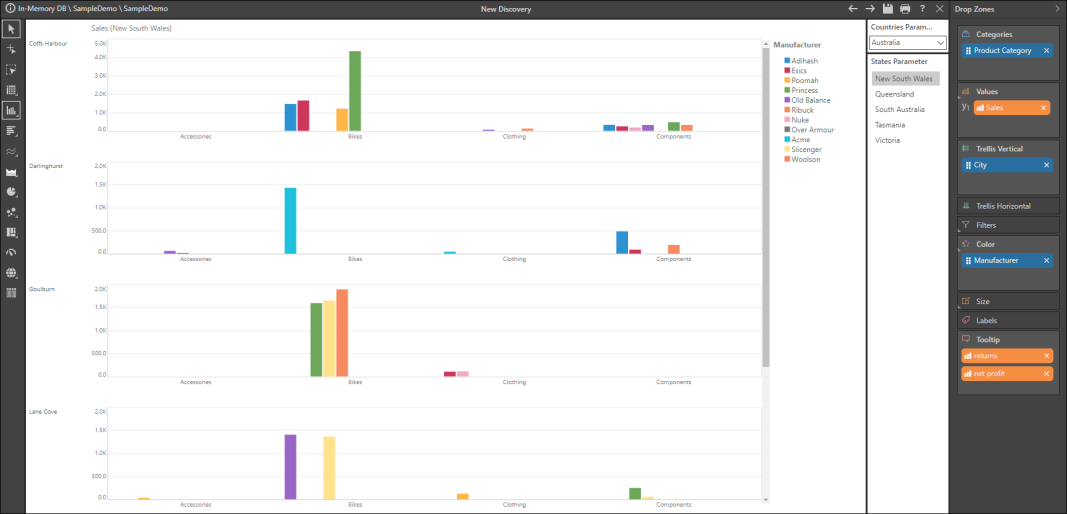
STEP 13
The custom set can be moved to other drop zones, in order to view the city within the visualization. In the screenshot below, column chart visualization was selected, and the City custom set was moved to Trellis Vertical. Now, each chart represents a different city within the state selected from the slicer. Product Category is on the x axis, while the Manufacturer drives the colors
STEP 14
Save the visualization for later use.